Measuring the ROI of a banking Design System: making the invisible visible
How I built a measurement framework for a Design System used by around twenty French banking brands, drawing on research literature, peer practices, and field interviews.
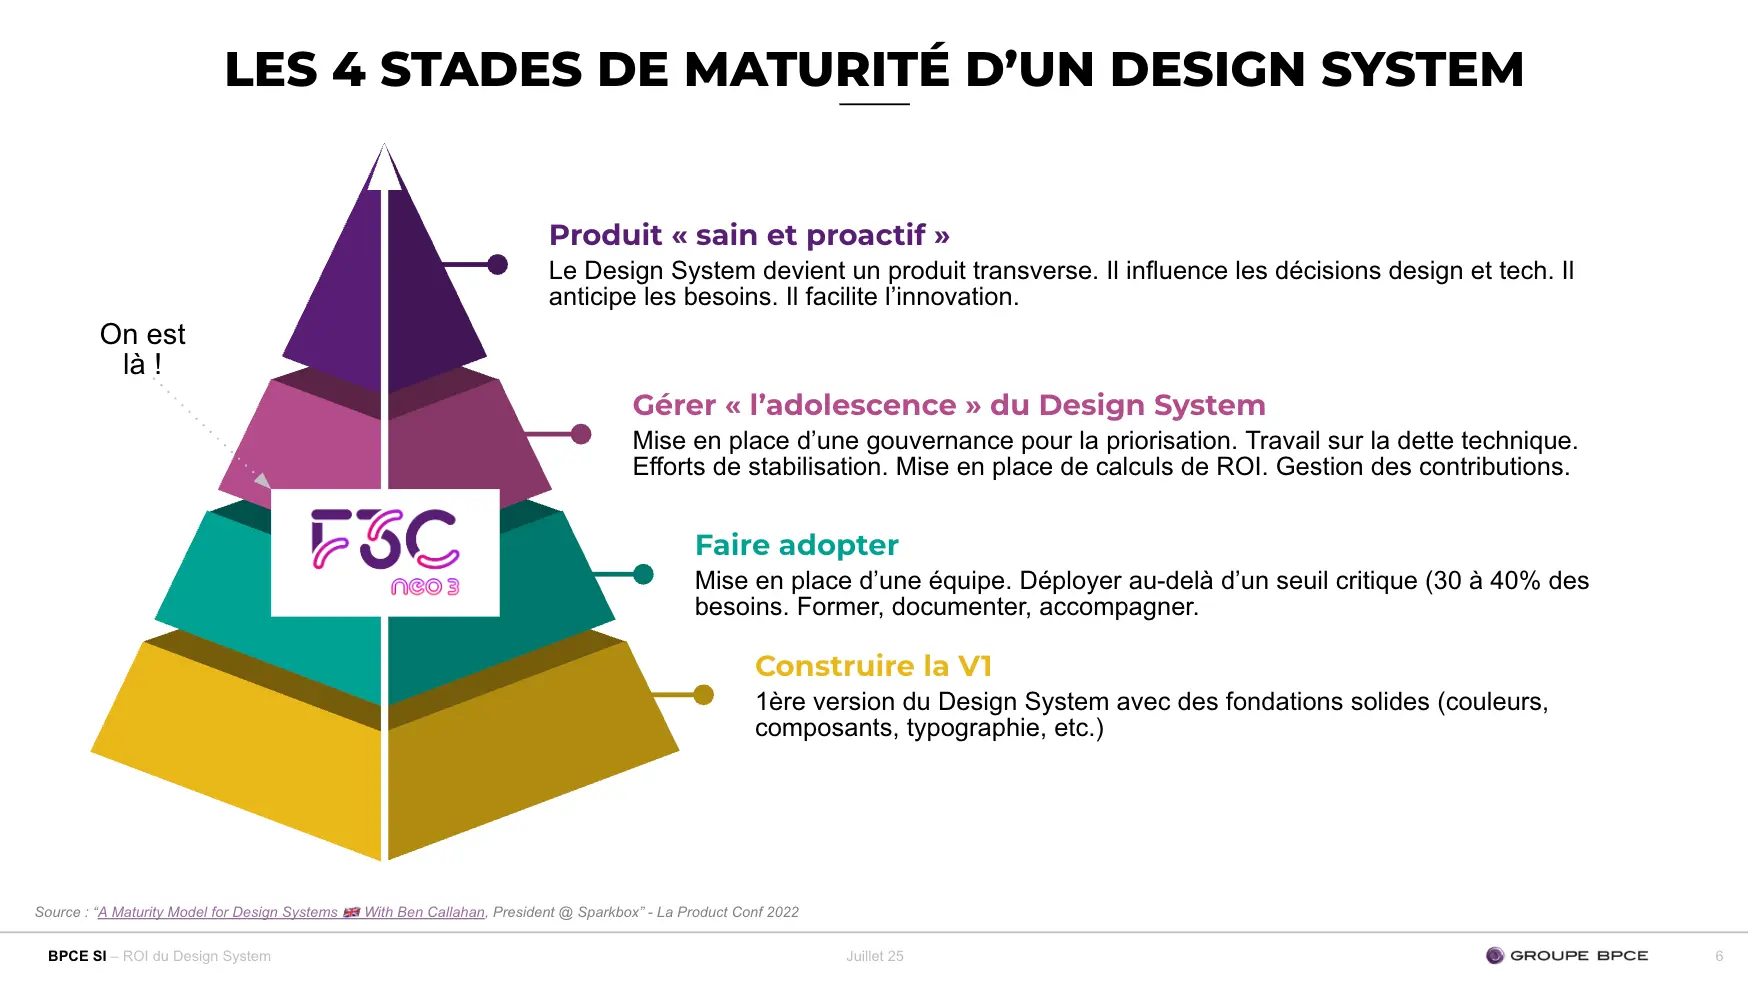
Source: Ben Callahan, Sparkbox · La Product Conf 2022
Project overview
Ingredients
Project
ROI measurement framework for the NEO3 Design System
Client
BPCE SI (the IT solutions arm of the BPCE Group, which includes Banque Populaire and Caisse d'Épargne, among others)
Design System scope
Around twenty French banking brands within the group
Technical backbone
F3C, the engineering platform that supports NEO3
Project duration
4 months (April to July 2025)
Actual workload
15 days (initially 8, extended during the project)
My role
UX Design Strategist and Design Ops Manager, solo engagement
Sponsors at BPCE
The Technology Lead Manager for Frontend Frameworks and the Design System Asset Owner
Initial brief
Build a structured tracking framework to measure the impact of NEO3
Ben Callahan maturity model (Sparkbox) · 3 stabilisers: Authority/Value/Tradition · Nathan Curtis adoption model
Final deliverable
Strategic report presented to the COPAS (steering and arbitration committee) in July 2025
Results
A quantified business model showing NEO3 can reach a 5x ROI if investment continues, against a drop to -3.9x if funding is cut · 4 ROI improvement axes · 3 proposals to sustain the Design System · 4 key indicator families (KPIs) proposed for ongoing tracking
Context
A vague brief behind a strategic question
BPCE SI is the IT solutions arm of the BPCE Group. The BPCE Group is the 3rd largest French bank, the 6th largest in Europe, and the 21st largest worldwide by total assets. It operates more than 8,200 branches across France under its various brands, including Banque Populaire, Caisse d'Épargne, Natixis, Palatine, Casden and Crédit Coopératif. In the first quarter of 2026, the group recorded net banking income of €6.8 billion and a net profit of €1.0 billion. At this scale, any cross-cutting digital tool, like a Design System, carries a significant coherence challenge: it must work across dozens of brands, thousands of employees, and millions of end users. BPCE SI produces, maintains and develops the digital tools used by the group's employees and clients.
NEO3 is the in-house Design System (the shared library of graphic components and rules used to build interfaces). It runs on F3C, the engineering platform that handles its distribution and integration into projects. NEO3 is used by around twenty brands within the group.
The brief I received came down to one sentence: "Help us build a structured tracking framework to measure the impact of NEO3."
Behind that sentence, several strategic questions remained open. NEO3 had been in use for several years. It enjoyed a positive internal reputation, but its return on investment had never been quantified. Teams knew it saved time, but no one could say how much. In an organisation that arbitrates its project budget every year, being unable to quantify the value of a cross-cutting asset means risking its reduction at the next budget review.
The real ambition of the project was not simply to propose indicators. It was to build a quantified narrative, solid enough to defend NEO3 before the investment committee and to guide strategic decisions over the next 2 to 3 years.
The challenge
How do you quantify what seems unquantifiable?
Measuring the ROI of a Design System raises a well-known methodological problem. Three concrete difficulties stood in the way.
A Design System is not an isolated feature. It is a cross-cutting infrastructure whose value builds over time, and whose benefits spread across teams without always being attributable to a single cause.
Challenge 1
No before/after baseline
NEO3 had existed for several years. Comparing "before NEO3" and "after NEO3" on the same product was not possible, because the products had evolved in parallel. Time savings were felt, but not measured.
Challenge 2
Scattered data
Indicators existed, but were scattered across Jira, Figma, Confluence, GitHub, and support tools. No one had yet consolidated these sources into a unified ROI-oriented view.
Challenge 3
Unstructured qualitative material
Teams had a lot to say about NEO3, but their feedback circulated through informal channels (Teams messages, corridor conversations). That input was valuable, but had never been turned into a structured argument.
The challenge was not simply to "find the right KPIs". It also required building a method capable of transforming heterogeneous sources into a narrative defensible before an investment committee. The value of a Design System is demonstrated through quantitative data, peer practices, and field voices together.
My role
Four interlocking dimensions
I led this project solo, with two sponsors at BPCE: the Technology Lead Manager for Frontend Frameworks and the Design System Asset Owner. Both were involved at every key stage. I validated the research plan, interview guide, early findings, mental models, and final report with them.
My scope covered four dimensions.
Research
I produced a synthesis note of around fifteen pages on Design System ROI, drawing on specialist literature (Sparkbox, Nielsen Norman Group, Forrester, Ekino), published case studies (Crédit Agricole, GAP, Kaiser Permanente, REA Group, IBM), and the theoretical frameworks of Ben Callahan and Nathan Curtis.
Field research
I conducted 15 semi-structured interviews with BPCE's internal developers and tech leads, and 4 external interviews with peers from reference organisations. Method and source details are in the Three sources for a narrative section.
Modelling
I built a business model projecting NEO3's cumulative ROI across 5 maturity stages, using conservative assumptions (I applied a -35% time saving for the early years, while Sparkbox measures -47% on IBM's Carbon). I produced a counter-scenario, "what if funding was cut?", to demonstrate the cost of inaction.
The narrative
I produced the strategic report presented to the COPAS steering committee in July 2025: an 8-point executive summary, a 3-persona user segmentation, 4 improvement axes, 3 sustainability proposals, and 4 KPI families proposed for ongoing tracking. From this report, I also prepared a short narrative that the Technology Lead Manager used during the investment presentation in September 2025 to defend the continuation of NEO3.
The approach
Diagnostic, foundation, roadmap
I structured the project in three successive phases, following a progressive construction logic. Each phase was validated with the sponsors before moving to the next.
Phase 1 · ~3 days
Diagnostic and assessment of existing value
Understand where NEO3 stands on the Sparkbox maturity model. Identify already visible achievements. Cross-reference existing data (Jira, Figma, Confluence, support, public presentation transcripts). Compare use cases with and without the Design System.
OutputNEO3 positioned between the end of stage 2 (Driving adoption) and the beginning of stage 3 (Managing the Design System's adolescence), with an analysis of Ben Callahan's three stabilisers: Authority, Value, and Tradition.
Phase 2 · ~6 days
Defining a tailored measurement foundation
Identify relevant indicators for different profiles (design, development, end users, business). Prioritise simple, accessible and useful indicators. Conduct the 15 internal and 4 external interviews to test hypotheses against field reality.
OutputSelection of 4 priority ROI axes, 3-persona segmentation, tracking dashboard template with proposed KPIs.
Phase 3 · ~6 days
2 to 3-year roadmap
Define short and medium-term development axes for the measurement system. Build the projected business model. Equip the sponsors to defend NEO3's value to their internal stakeholders.
OutputPrioritised roadmap, quantified business model across 5 maturity stages, argument brief for senior management, 3 sustainability proposals.
Research method
Three sources for a narrative
To turn a vague brief into a defensible argument, I drew on three complementary research moves. Taken separately, each would have been insufficient. Taken together, they produced a triangulated narrative that no one could dismiss as "subjective".
01
Secondary research — what the literature says
I produced a note of around fifteen pages, structured in three parts: key figures and measured benefits, ROI evaluation methods, testimonials and concrete examples.
Some particularly structuring sources:
Ben Callahan (Sparkbox): 4-stage maturity model, three-stabiliser model (Authority/Value/Tradition), "3E" cadence Educate/Engage/Evolve. Reference measurement on Carbon (IBM): -47% development time. (La Product Conf 2022 talk)
Nathan Curtis: 3-level adoption model (Encourage → Enable → Enforce), Core/Satellite governance. (EightShapes articles on Medium)
Forrester: significant projected ROI on sites with a mature Design System, measured gains on conversion and propensity to spend.
I conducted 4 interviews with Design System Managers and Design Ops Managers from reference organisations in French fintech and banking. The goal was not to copy, but to understand which measurement practices actually worked in contexts comparable to BPCE.
A major French banking group(through a Devoteam consultant, former Design Ops lead at that group): each digital project contributes a fixed percentage of its budget to fund the Design System centrally. A quarterly satisfaction survey tracks designer sentiment. DS reviews are mandatory before any production release.
Spendesk(Design System Manager): piloted by a "Coverage" KPI tracking Design System adoption by product teams, automated accessibility tests integrated into the quality pipeline.
Qonto(Design System Manager): governance practices and multi-team contribution management.
A major French banking group(Managing Director, Product Design and AI transformation): how the organisation is rethinking the relationship between its Design System, AI tooling, and product transformation, in a context where those three forces are converging.
What these interviews specifically contributed
Material that no public literature provides, because these practices are rarely documented externally. This is what made it possible to propose directly actionable recommendations, rather than abstract best practices.
03
Internal research — the field voice
I conducted 15 semi-structured interviews with BPCE's internal developers and tech leads. The panel was co-built with both project sponsors, to ensure it represented the different user segments (internal and external clients) and the different technical platforms (web, mobile, and others).
For each interview, a profile-tailored guide, and a structured interview summary covering:
Context and profile of the interviewee
Perceived impact of NEO3 in practice
Mapping to the 4 ROI axes (adoption, debt, compliance, onboarding)
Rating of discussed metrics on a 1-5 scale
Self-assessed quality & accessibility score
Identified barriers and drivers
Prioritised recommendations
Output of this phase
These 15 interviews allowed me to develop the 3-persona segmentation presented in the next section.
The business model
A ROI that can reach 5x
Drawing on the collected material, I built a business model projecting NEO3's cumulative ROI across the Sparkbox maturity stages.
The model rests on four quantifiable benefit axes:
Axis 1
Adoption
Hours saved on development as NEO3 is used across more screens.
Axis 2
Debt & migrations
Reduction of migration costs and technical debt through standardised tools.
Axis 3
Accessibility compliance
RGAA (France's general accessibility improvement framework) fines avoided and inclusive brand image preserved.
Axis 4
Onboarding
Shorter time to autonomy for new developers through starter kits.
For each axis, I applied deliberately conservative assumptions. For instance, while Sparkbox measures -47% development time saved on Carbon (IBM), I retained only -35% for the early years, with a progressive increase toward -47% as NEO3 gains maturity.
Projected business model across 5 Sparkbox maturity stages · Conservative assumptions
Scenario 1 · Continue the investment
ROI can reach 5.5x
+5.5x at plateau
The model projects a net ROI rising from 0.2x in the build phase (Year 0/1) to 5.5x at plateau (years following adoption above 75%). In other words, each euro invested in NEO3 would generate up to 5.5 euros in cumulative benefits once maturity is reached.
Scenario 2 · Cut the funding
ROI drops to -3.9x
-3.9x at plateau
If investment in NEO3 were reduced to a minimal maintenance budget, the net ROI would fall to -3.9x at plateau: untreated technical debt would accumulate, migration costs would explode, and RGAA non-compliance would generate fine risk.
The 3 personas
Three personas, three different needs
The 15 internal interviews surfaced three very distinct profile types in relation to NEO3. This segmentation made it possible to tailor recommendations rather than propose a one-size-fits-all action plan.
👑
The Champions
Enthusiastic experts
High maturity (4-5/5). Mainly internal tech leads. Strong adoption, overload rate below 5%, comfortable with documentation.
"I see NEO as an accelerator. What I need now is visibility on what comes next."
Their barrier is no longer adoption, but managing breaking changes and roadmap visibility. Their needs: a participative and prioritised roadmap, access to metrics for better tracking, stronger support on migrations.
🤝
The Pragmatists
Intermediate users who spread the word
Medium maturity (2-3/5). Internal/external mix. Heterogeneous adoption, overload rate 10-15%. They juggle several legacy Design Systems, which complicates their day-to-day work.
"Since we adopted NEO3, we've stopped going off-piste. If a UX designer proposes something that doesn't fit the system, we bring it back in line with the guidelines."
Their quality assurance (QA) practices are inconsistent. Their needs: ready-to-copy examples, QA processes for style and accessibility, support on breaking changes and migrations, roadmap visibility.
🧭
The Explorers
Cautious beginners
Beginner maturity (1-2/5). Mainly new joiners and external contractors. Low adoption, overload rate 10-15%, low RGAA compliance with fine risk.
"Understanding the documentation and figuring out what I actually needed was complicated. I spent a lot of time on it."
They struggle to adapt components to their context. Their needs: illustrated step-by-step documentation with full-page examples, a clear component request process, introductory workshops and knowledge-sharing formats with the Champions.
Recommendations
Four axes to increase ROI, three levers to sustain it
Drawing on the diagnostic, the business model, and the interviews, I proposed two levels of recommendations.
🎯 Four ROI improvement axes
Concrete levers to increase the value generated by NEO3 across each of the 4 measured axes.
Axis 1
Adoption → Time saved
The more screens reuse NEO3, the less code is written. The time from mockup to production shrinks, and each additional adoption point multiplies the return on investment.
Axis 2
Debt & migrations
Propose automated migration scripts (schematics, in the Angular CLI sense) so migrations no longer cost as much per project, absorbing the cost at scale. Without tooling, a major migration can cost up to 200 working days per project.
Axis 3
Accessibility compliance
Linters and automated audits can eliminate 70% of gaps. Zero fines, inclusive brand image preserved. This is especially strategic for BPCE as a banking institution subject to the RGAA requirements.
Axis 4
Onboarding
An interactive starter kit accelerates NEO3 onboarding. Velocity increases from the first agile work cycle. Target audience: new developers and external contractors.
🛡 Three proposals to sustain NEO3
Structural levers to secure the Design System investment over time.
Proposal 1
Participative funding
Establish a mandatory NEO3 contribution of 2% of project cost for any project budget above €1M. Inspired by a major French banking group: secures the Design System budget without depending on annual arbitration, and justifies permanent hires.
Proposal 2
Product governance
Give the NEO3 team a seat at major investment committees, to anticipate project needs upstream rather than reacting to demands downstream.
Proposal 3
Value measurement
Track 4 "fast-ROI" KPIs quarterly: component reuse rate, migration days avoided, accessibility score, time-to-first-page. Chosen because they are both easy to instrument and readable by an executive committee.
Project voices
What the people who worked on this project with me say
Verbatims to come, collected from people involved in the project.
"Verbatim to be collected."
"Verbatim to be collected."
"Verbatim to be collected."
What I would do differently
What I would do differently
Variant 1
Securing an executive sponsor from the start
The project was commissioned and supported by two very solid sponsors at BPCE, but the COPAS presentation would have benefited from an executive-level sponsor identified from the start. With more time, I would have framed the conditions for a top-level presentation during the proposal phase, and identified a COMEX-level champion for the initiative.
Variant 2
Automating data collection earlier
I drew on existing data (Jira, Figma, Confluence) to build the business model, without an automated pipeline. With more time, I would have proposed automatic instrumentation of the 4 fast-ROI KPIs from the first phase, so the dashboard could outlive my engagement.
Variant 3
Including designers in the workshops
The 15 internal interviews focused mainly on developers and tech leads, consistent with the project's scope (NEO3 seen from the tech side). But NEO3 also has users on the Product Design side. A co-design workshop with designers would have added a creative usage perspective to complement the technical one, and grounded the recommendations on an even broader panel.
Credits
Project conducted for BPCE SI(the IT solutions arm of the BPCE Group). Commissioned and supported at BPCE by the Technology Lead Manager for Frontend Frameworks and the Design System Asset Owner.
Sources used:
Theoretical framework: Ben Callahan (Sparkbox), Nathan Curtis (EightShapes), Dan Mall.
External research: 4 interviews with Design System Managers and Design Ops practitioners from reference organisations in French banking and fintech: a major French banking group (through a former Design Ops consultant), Spendesk, Qonto, and another major French banking group.
Secondary research: Sparkbox, Nielsen Norman Group, Forrester, Ekino, published accounts from Crédit Agricole, GAP, Kaiser Permanente, REA Group, IBM, Salesforce, Etsy.
Public BPCE × Figma presentation("In the File: Tokens & Multi-brand Design System") on YouTube, which documented NEO3's technical architecture.
My particular thanks to the 15 people interviewed internally at BPCE, and to the 4 external peers who gave their time.
Contact
Does this resonate?
Do you have a Design System you know creates value, but cannot yet demonstrate it? Are you preparing a budget review and need a quantified argument? Do you want to build a measurement framework that holds up through organisational change?
30-minute discovery call, free, no strings attached.